Re-connecting the public service: Openness and data sharing during the COVID-19 pandemic
In early 2020, the COVID-19 virus was just beginning to spread across the globe. In response, New Zealand’s Prime Minister, Jacinda Ardern, implemented strict border controls which barred non-citizens and permanent residents from entering the country. This decision shut the country off from major sources of revenue derived from international tourists and foreign students. Strict quarantine measures also complicated the process of importing and exporting goods.
Economists knew that these major systemic shocks could force New Zealand’s economy into a major recession. But in the early days of the response, people were quarantining at home and no one was certain of any particular outcome (Zollne et al 2020). Amidst this unprecedented uncertainty, policymakers sought out information sources that would be continuously updated so that they could make appropriate interventions with the goal of preventing a large-scale economic collapse (Evans 2020).
The COVID-19 Data Portal was a Stats NZ initiative to provide up-to-date information to policymakers and the public during a time of unprecedented uncertainty caused by the global pandemic. This chapter explains the development of the data portal by contextualizing its development broadly in terms of both the history of changes to the way the New Zealand public approached policy as well as the new responsibilities for data stewardship in government given to Statistics New Zealand.
For the past 30 years, a number of initiatives have been introduced intended to modernize the New Zealand public service. These initiatives have arguably resulted in a public service that is more responsive to the strategic goals of government. However, there is evidence indicating that the increased focus on accountability for government’s goals has disincentivised inter-agency collaboration — leaving most agencies operating in silos because previous initiatives that were not aligned with the immediate goals of past governments, have been gradually removed (Ryan 2012, p. 2).
More recently there has been recognition of the need for inter-agency co-operation to provide New Zealand residents with high quality public services (Ryan 2012). Despite ongoing challenges to collaboration within government, there is reason to believe that connections between government agencies are being re-established. In 2017 Liz MacPherson, Chief Executive of Statistics New Zealand, was also made Government Chief Data Steward (Stats NZ 2017). This effectively broadened the purview of Stats NZ to provide assistance for managing data for the New Zealand government system. Stats NZ is also in charge of other government initiatives to promote open government through supplying more open data.
Seen through these legislative and organizational changes, the implementation of the COVID-19 Data Portal is a case study in the creation of tools and resources to support different government agencies through data related projects. By making all of the data supplied public by default, the goals of greater transparency and openness are also served. The data portal does not, in itself, foster collaboration between government agencies but it does provide a positive example of how information and communications technology (ICT) and data management can be used to help reconnect government agencies through coordinated action.
This chapter is split into two parts. In the first part, I briefly outline some of the major changes that have been made to improve the way that the public service creates and delivers policy. I show the progress these programs have made and argue that despite these gains there has been a tendency for agencies to remain siloed. Recent findings from the Auditor General in 2018 highlight ongoing barriers to collaboration (New Zealand Controller and Auditor General 2018). The first part ends with a discussion of the new mandate given to Stats NZ to help agencies manage data more effectively.
The second part details the growth and development of the COVID-19 data portal and explains the process by which the portal became a clearinghouse facilitated by Stats NZ for public and private information during early days of the COVID-19 global pandemic.
A more efficient public service
In the early 1990s, in an attempt to gain better value for money out of their public service, New Zealand’s politicians experimented with a number of new initiatives intended to bring greater efficiency to the public service. These initiatives focused on both the way work in the public sector was done as well as re-evaluating the way the quality of the work should be assessed.
At the risk of overly simplifying a complex topic, the work of public employees often involves dealing with complex and difficult socio-economic problems which seldom have a direct private-sector analogue. In the early 1990s there was political consensus that institutions were too focused on the short term, lacked coherent strategic goals and produced poor policy advice (Foreman 2016; State Services Commission 1999).
In response to this, the New Zealand government took on an ambitious reorganization of the public sector. Those that sought to modernize the public service realized that short-term measurable outputs, such as activities or products, were being prioritized over the broader outcomes of programs (Lunt et al 2003; Mayne 2001). To re-orient them to the bigger picture, agencies went through a comprehensive strategic realignment designed to develop what were called strategic result areas (SRAs).
SRAs were high-level strategic goals such as increasing economic growth, enhancing innovation, protecting the environment — essentially the fundamental goals of government. To help guide progress in the SRAs, agencies prioritized more specific, measurable key result areas (KRAs).
KRAs were assessed every year. These assessments were then fed into the following year’s goal-setting process (Foreman 2016). The idea was that the series of assessments would form a virtuous cycle that would result in ongoing annual improvements.
Despite these intentions, the SRAs and KRAs became little more than ‘checklists’ (Foreman 2016, p. 6). The effectiveness of the program was partially limited by the fact that there was no way to measure progress on these strategic goals (Cook 2004, p. 5). By the later half of the 1990s, SRAs and KRAs were replaced with strategic priorities and overarching goals (SPOGs). However, this approach was also unsuccessful because SRAs, KRAs and SPOGs lacked any common form in which they were supposed to be written across agencies or legal standing (Foreman 2016; Office of the Auditor-General 1999, p. 48).
The year 2001 saw the State Services Commission report ‘Review of the Centre’ (Ministerial Advisory Group 2001). The report argued that fragmented government agencies were struggling to deliver the kind of integrated services citizens expected. Among other things, it called for greater innovation in the public service and a corresponding investment in and development of the capabilities of staff.
By 2004, many of the issues highlighted by the ‘Review of the Centre’ report were being remedied through legislative changes. The Public Finances Act 1989 was changed to necessitate long-term fiscal reporting (Foreman 2016, p. 8). The change effectively provided an avenue for agencies to express their longer-term strategies. The government was also trying to make more progress towards an effective system of results-based management (Cook 2004).
Significant problems remained, however. In 1999, an occasional paper produced by the State Services Commission highlighted problems with the quality of advice coming from agencies (State Services Commission 1999). By 2010 another report by the New Zealand Institute for Economic Research (NZIER), a think tank, still showed significant variation in the quality of advice that agencies were giving (New Zealand Treasury 2010, pp. 38–39). Out of a sample of 20 agencies, only a few were rated as giving good advice while about half were rated as just adequate.
The recent past
In 2014, a briefing for the incoming government outlined many of the problems that continued to plague the public service. A lack of a learning culture and risk aversion within the public sector were chief among the problems highlighted that were holding the government back from innovating (Jones & Hooper 2017; New Zealand Government 2014; Ryan 2012). The briefing again noted the lack of cross agency collaboration. These were the same issues that were highlighted over a decade before in the ‘Review of the Centre’ (Ministerial Advisory Group 2001; New Zealand Government 2014; State Services Commission 1999).
In his review of New Zealand’s early reforms written in 1996, Schick warned of an implicit trade-off between implementing systems of managerial accountability and having the public service operate due to public servants’ sense of responsibility (cited by O’Leary et al 2014, p. 22; Schick 1996, pp. 84–85).
Indeed, interviews with public servants indicate that excessive emphasis on accountability has decreased inter-agency government collaboration. Once inter-organizational ties are cut, they are difficult to re-establish. Managers who are focused on accountability tend to over-measure performance. This puts undue stress on public servants actively trying to engage in inter-agency collaborative projects (O’Leary et al 2014).
Public servants know that new initiatives can be risky and there is rarely a simple template for their success. This uncertainty about collaborative initiatives coupled with a professional need to avoid negative performance assessments has led many public servants to avoid collaboration initiatives altogether. As one public servant put it, ‘collaboration will mess up my performance metrics’ (O’Leary et al 2014, pp. 23–24). Thus, the lingering effects of changes to accountability in government mean there are few incentives for public servants to engage in cross agency collaborative initiatives.
Data sharing in government: the Auditor General’s findings
A 2018 review by the Auditor General of New Zealand examined how government agencies use and share data. The investigation found a number of challenges in how data was used in the public sector. Among the report’s findings was a hesitancy amongst managers to accept the suggestions of data analysts because of a fear of failure if new initiatives were implemented. The report identified behaviour that amounts to status quo bias, which is strong in the public sector (New Zealand Controller and Auditor General 2018).
Other problems within the public sector have made it more difficult for evidence-based decision making to take hold. Chief among these is that public servants do not have a strong data analysis skill set. Instead, managers search fruitlessly for people with a rare combination of the ability to structure data sets, investigate data, analyse data and communicate clearly with colleagues in the public as well as with senior managers (New Zealand Controller and Auditor General 2018).
The Auditor General’s report indicates a fundamental uncertainty within the public service about when and what types of data should be shared between different agencies. As an example of this adversity to risk, senior managers may block the sharing of data out of concern that a directive will be broken or confidentiality breached. The Auditor General also found basic misunderstandings about the law around data privacy, an inability of IT systems to properly connect agencies, and that agencies had varying priorities, as well as cost and security concerns.
The reticence to share information with other agencies should also be considered in the context of increased concern for individual privacy. New Zealand’s Privacy Act is intended to protect citizens from having their data stolen or otherwise misappropriated. Even managers with the best of intentions who want to share data with other agencies are often faced with uncertainty about when and how data should be shared (New Zealand Controller and Auditor General 2018).
Much of the uncertainty that agencies face is around the release of the personally identifiable information of New Zealand citizens and residents. When personal identifying information is properly aggregated so no single individual can be identified, it is much easier for government agencies to share data with others. Data sets capturing community level information on unemployment, health and social well-being are useful for policymakers seeking to make decisions. Advocates of more open government would like such aggregated data sets to be made more accessible.
Re-establishing ties
The last section of the review, outlined the challenges facing the public service after decades of initiatives intended to result in greater efficiencies. Despite some setbacks, clear improvements have been made. There now seems to be a longer-term strategic view from agencies that speaks to the government’s priorities. However, an excessive emphasis on accountability for these priorities has discouraged cross-agency connections not strictly geared towards these strategic goals (O’Leary et al 2014, Ryan 2012).
It is no small irony that the government wants the public service to now encourage these inter-agency ties to meet modern challenges. Given the problems outlined, it is little wonder that complex ICT projects or data sharing between agencies have met with limited success given the siloed nature of different agencies. However, there are other trends in government that show some promise in helping to repair these inter-agency links.
A more open government
In parallel with the intended improvements in the way the public service operates, government has become more open. For example, the Official Information Act (OIA) of 1982 gave people in New Zealand the right to request information from the government. Although not perfect, the law follows a general trend towards more open and responsive government (Macdonald 2020). Since then, the New Zealand government has joined the Open Government Initiative (OGI), initiated by US President Barack Obama in 2009 (New Zealand Crown 2021; The White House 2009). Countries that are part of the initiative agree to make more government data available to the public.
The increasing openness of government is arguably more democratic, but it can also have the effect of slowing decision making (Savoie 2010, pp. 126–128). Legislation such as the OIA has made it easier for the public to obtain the details of the decision-making process. The open data supplied because of the OGI has contributed to the online proliferation of increasingly detailed sources of information about a wide range of topics, undermining the public sector’s former monopoly on policy relevant data (New Zealand Treasury 2010, p. 2). This increasingly available data has allowed concerned members of the public to contest the policymaking process by introducing different interpretations of information. The result has been that more people are able to become engaged in policy advice deliberations that used to be held behind closed doors.
Changes within government also added more internal conflict to policymaking. The adoption of mixed member proportional (MMP) elections in 1996 changed the composition of governments by introducing coalitions. Coalitions mean that more policies are contested around the cabinet table, making investigating different policy alternatives politically difficult (New Zealand Treasury 2010).
Both these external and internal sources of conflict increased the demands by MPs to use the services of outside policy advisors. Outside advisors and task forces can investigate matters that are politically fraught, allowing MPs to avoid having to take direct responsibility for these investigations. Between 2003 and 2009, policy-advice related appropriations by government rose 70% in nominal terms to $888 million (New Zealand Treasury 2010, p. ii).
Policymaking can no longer easily take place behind closed doors. Instead, the process now has to deal with more external stakeholders overseeing decisions as well as possibly greater internal debate within the government itself when there are multiple parties in coalition. Given these changes to the policy process, it is not surprising that some MPs have come to see the public service as implementers of policy rather than the single source for advice (New Zealand Treasury 2010).
Changes at Statistics New Zealand
As New Zealand’s national statistical agency, Stats NZ is focused on capturing social and economic indicators that accurately reflect the circumstances of the nation. Statisticians, mathematicians, social sciences and computer programmers jointly work to fulfil this mission. The information they collect is used by government policymakers, businesses, academics and citizens to better understand their country.
In 2017, the Chief Executive of Statistics New Zealand, Liz MacPherson, was also appointed as Government Chief Data Steward. This appointment made Stats NZ central to the way data is handled in government. MacPherson’s new responsibilities included data architecture, infrastructure and standards related to data. Stats NZ’s new mandate includes helping other agencies deal with data properly, efficiently and according to consistent standards (Stats NZ 2017).
Stats NZ was also placed in charge of the country’s open data program. The goal of the program is to release high quality, but non-personally identifying data to the public in usable formats. The shift towards more open government and the provision of more open government data (OGD) are intended to benefit the public. Proponents of open government believe that better access to information and the data behind decisions made by governments, will lead to better democratic outcomes (Janssen 2012).
The Open Government movement, now led by a consortium of nations including New Zealand (Government of New Zealand 2011a; New Zealand Crown 2021), is increasingly challenging the way governments see their relationships with their citizens, other government agencies and governments internationally. Over the past decade, there has been an increasing trend for democratic governments to become more open; part of that has been to allow citizens better access to the information governments use to make decisions. Although the process is still ongoing, New Zealand’s government agencies have been early adopters. The agency has continued to adopt not only new technology and statistical techniques but also new management techniques to make the most of big data within the context of the demands for more open government (Evans 2020; Putt 2020).
Over the past decade, the government’s interest in big data and the growing Open Government movement have expanded the organization’s mission and encouraged some groups to begin to make changes to the way they do their work. The recent global pandemic has served to accelerate these changes. One of the most striking Open Government inspired projects is the COVID-19 Data Portal.
The COVID-19 data portal
The COVID-19 Data Portal was launched in April 2020 as part of the government of New Zealand’s response to the COVID-19 global pandemic (Putt 2020; Stats NZ 2020). This web portal grew out of a need for government agencies to centralize and share information. At the time of writing, the portal hosts more than 300 different data sets on economic, health, income and other social aspects related to the COVID-19 pandemic and New Zealand recovery efforts.
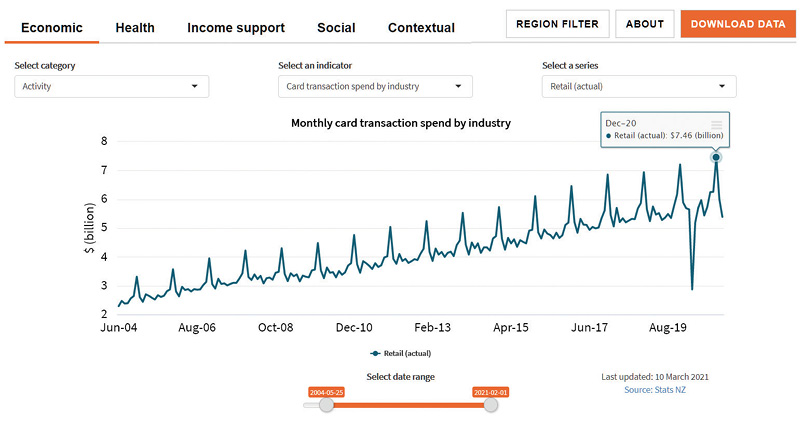
Figure 1: Monthly card transactions made in the retail industry.
COVID-19 Data Portal, www.stats.govt.nz/experimental/covid-19-data-portal
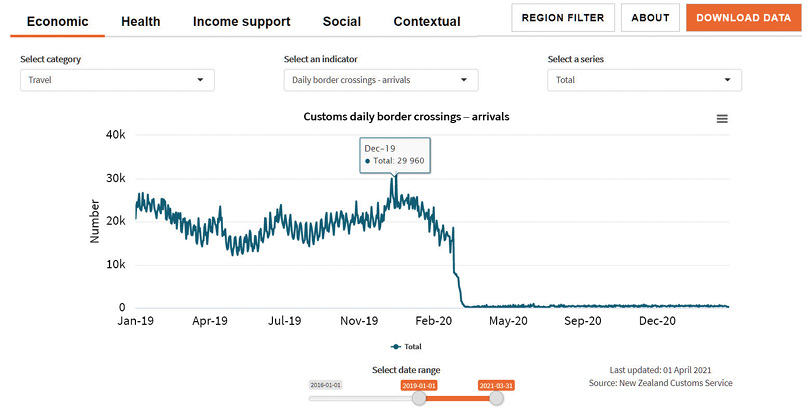
Figure 2: Arrivals into New Zealand (2019–21). This time series clearly shows the impact of the border closure on foreign arrivals.
COVID-19 Data Portal, www.stats.govt.nz/experimental/covid-19-data-portal
The portal itself is composed of five broad areas of interest. As of May 2021 these are:
- Economic
- Health
- Income support
- Social
- Contextual areas (for examples see Figure 1 and Figure 2).
Users of this site can choose specific categories of data to examine and drill down to view different indicators. Unlike many statistical agency websites, the data portal always displays an interactive visualization of the data the user chooses to view. A slider widget at the bottom of the screen is designed to allow the user to see the time series over different periods. Similarly, the regional filter allows users to examine data sets focused on a particular region of interest.
The COVID-19 Data Portal was designed as a one-stop portal for visual analysis of data. Users of the portal don’t need to transform the data, nor do they need to go through the process of determining how to best visualize the data. Instead, they need only choose the type of information they’re interested in, which is already divided into thematic categories that can be chosen through drop-down menus. People can visually explore each type of information to test hypotheses about the impact of COVID-19 and the ensuing lockdowns.
Stats NZ: rapid response to the pandemic
As the pandemic continued to spread across the globe, policymakers needed to know the trade-offs involved with any policy response to the virus. What action would be most effective? How much would it cost? Who would it affect? How would this course of action impact other government priorities?
Early in the pandemic, the most common response to the virus was to enter a region into lockdown, which was thought to have the potential to completely eradicate the virus. A total lockdown effectively halted all non-essential movement and allowed only basic economic activity. One thing was certain: a lockdown was not to be undertaken lightly as it inflicted severe economic and social costs. Policymakers wanted to know the likely economic outcomes of any decision they chose to make. They also wanted that information to be as close to real-time as possible.
Statistical indicators produced by Stats NZ take time to finalize. Information needs to be collected, collated, interpreted and verified before the final reports are produced for public consumption. The Consumer Price Index (CPI), Labour Force Survey (LFS), employment turnover reports and Gross Domestic Product (GDP) reports can take weeks or months to produce. Even more problematic, these statistical products generally just describe events from the previous business quarter. Although the figures are very reliable, Stats NZ needed to supply more timely information than these quarterly reports were capable of supplying. Policymakers required more real-time information — something most economic data collection processes were simply not designed for (Evans 2020; Putt 2020).
This led to a reassessment in the organization of what was meant by quality. Stats NZ found its data to be accurate and coherent — everything made sense and was well documented but their information was not timely enough. This led to a reassessment by policymakers — the key stakeholders Stats NZ wanted to help during the crisis. The urgency of the worsening pandemic meant policymakers were willing to accept reduced accuracy and coherence if they could gain more timely information (Evans 2020). In short, having some data describing the situation imperfectly was deemed to be better than having perfect information too late.
Reaching out
Richard Evans, Stats NZ general manager for economic and environmental insights and his team were originally behind the COVID-19 Data Portal. But as momentum behind the project grew, other data analysts also contributed.
In a presentation he gave at the University of Auckland Business School in October 2020, Evans said he was pleasantly surprised by the positive responses from the private sector. They too realized it was a crisis and were willing to share their data for use on the portal. Evan’s team at Stats NZ could not vouch for the quality of these data but knew their clients were actively consulting them. So, they integrated them into the portal to make the best use of all available data possible. Each visualization carries information about the source of the data.
During the early iterations of their new product, Stats NZ reached out to key policymakers at the Treasury, the Ministry of Business, Innovation and Employment (MBIE), and the Reserve Bank. In these organizations, policy analysts were struggling to find high-frequency data to use in briefings to ministers and other executives. Each of these organizations had found some high-frequency data that was useful for their particular problems. However, no organization was completely self-sufficient in data and there was still a need for more diverse data for better decision making.
These early consultations with different organizations led to the realization that there was no single set of information that each agency needed. To respond to the needs of each of these different organizations, Stats NZ compiled and frequently updated a PDF document comprised of the 12 different times series stakeholders found most useful. This data included traffic measures, retail purchase information based on card transaction data, electricity generation, the number of new online job postings and a business performance index. Almost all of this data was produced in the private sector and didn’t follow the careful processes normally followed by Stats NZ used to ensure high quality and reliable data.
Over time, the simple document grew from twelve charts to more than 30. Soon, more people in government began to ask about the document so they too could get the latest releases. To streamline the operation, one of the programmers at Stats NZ had the idea to use the R statistical programming language1 (Ihaka 1998; The R Foundation 2021) and a related package, R Shiny (RStudio Inc. 2021), to create the first iteration of the COVID-19 Data Portal.
1 R is an open-source statistical programming language. The R language was invented by two researchers at the University of Auckland nearly 30 years ago. The open-source licensing of R means that people from around the world can freely access and modify the language. Unfortunately, this fascinating history of this language is outside the scope of the present chapter.
The move from a PDF to a portal was a significant improvement. Users could see up to date information any time. The website presented interactive visualizations that provided a level of detail that PDF documents could not. The website could also be accessed by anyone, making it easier to distribute results to different stakeholders, including the public.
After their initial success, the team at Stats NZ talked with some key agencies to ask them about the types of data they still needed. In particular, they asked if their analysts were still transcribing data from websites or manipulating existing data in order to visualize it for reports for their senior executives. Stats NZ offered to take the burden off them for creating and maintaining this information by putting it on the dedicated data portal. They offered to build a simple application programming interface (API) to allow data to be submitted to the portal and proposed to write customized data processing tools to automatically manipulate data into a standardized form to be used by the portal.
In exchange for sharing their data with Stats NZ, these agencies gained transparency and the public gained greater access to data being used by decision makers. Agencies gained easy access to information that would be automatically updated, and the open nature of the portal meant that the public would know what data was being used to make important policy decisions.
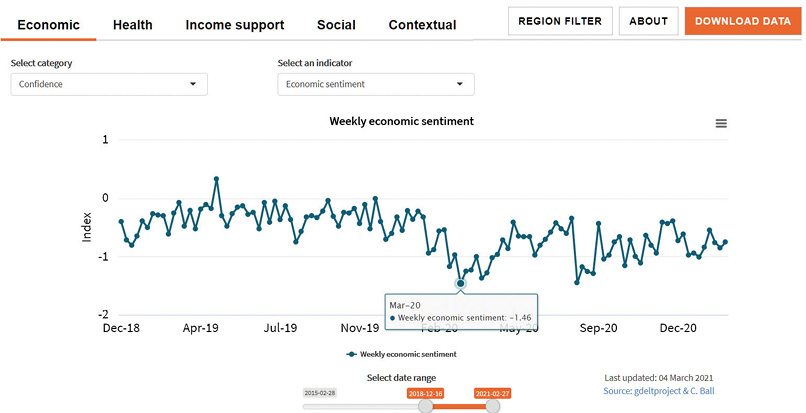
Figure 3: Weekly economic sentiment based on data derived from the GDLET project.
COVID-19 Data Portal, www.stats.govt.nz/experimental/covid-19-data-portal
Openness and experimentation
The open aspect of the data portal meant that the portal could be more than just a one-way source of information. Once the portal was up and running it was also possible for analysts from other agencies to contribute useful and, in some cases, provisional data to the portal. For example, a Treasury analyst created an experimental economic sentiment index based on real time news article reports (see Figure 3). The data he used is freely available through open APIs courtesy of the Global Data on Events, Language and Tone (GDELT) project (Leetaru & Schrodt 2013). GDELT processes a global database of news stories from around the world. The GDLET project has created an interface for people to run algorithms on the news sources. This is what was used to create the index of global economic sentiment. This new time series became another way for the portal’s stakeholders to better understand the potential economic impact of the pandemic.
Outside expertise
The process of putting together the data portal had involved bringing together data analysts from multiple different government agencies. Stats NZ could help those less quantitative agencies bring their data into the portal through the use of their APIs. They also discovered they could use some of the technical expertise from their partner agencies.
One of the key challenges facing Stats NZ was to develop a high-frequency proxy measure for gross domestic product (GDP). A number of different approaches were discussed, including launching a rapid response survey to measure GDP. Instead, Stats NZ settled on utilizing the high-frequency proxies it could already access to create an activity index. The activity index is a weighted sum of multiple different measures including: consumer spending, unemployment, job vacancies, traffic volumes, electricity generation, business outlook and manufacturing activity (New Zealand Treasury 2020). The index was designed to reflect economic activity in New Zealand. The trade-off is that the index is not as accurate as official statistics would be, but it is much timelier and it is that timeliness that decision makers need in a crisis.
Stats NZ lacked in-house expertise on how to best create such an index. Instead, a colleague at the Treasury constructed what is now called the New Zealand Activity Index (see Figure 4). The index is based on the principal components of eight high-frequency indicators (for technical details, see New Zealand Treasury 2020). The Activity Index tracks well against historical quarterly GDP measures and so provided the validity check needed to launch this new measure on the data portal.
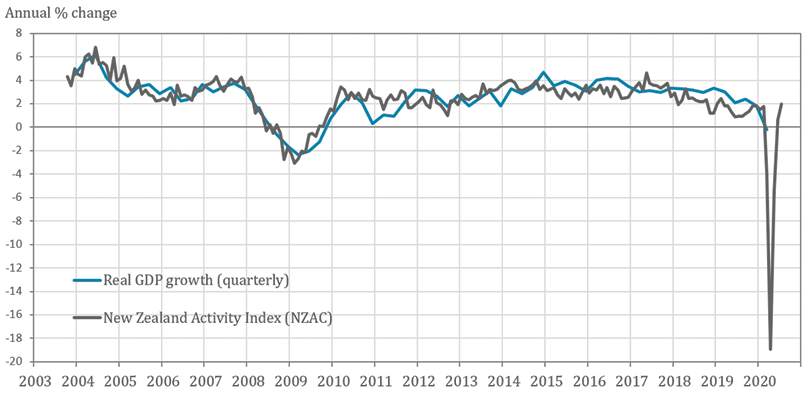
Figure 4: New Zealand Activity Index (NZAC) compared to Quarterly GDP growth measures.
Richard Evans, Stats NZ
Development approach
Richard Evans credits the success of the project to the agile approach that his team took. Throughout the development process the team made great efforts to find out what their clients actually needed. The only way they could do that was to sit down with them and understand the sorts of challenges that they face. Once they had a clear idea of the problems their clients faced, they set about to create a minimum viable product. In this case, that minimal product was a simple PDF document that they sent around to different agencies. Based on their feedback, they created the data portal.
Conclusion
In this chapter I have outlined the ongoing challenges the public service has faced in collaborating, developing policy and sharing data between agencies. Giving the responsibility for stewardship of government data to Stats NZ represents a new opportunity for government agencies to work together more effectively on joint projects. The COVID-19 Data Portal is a case study in the creation of a successful program that assists policymakers with the data needs in an open and accessible manner.
By taking responsibility for the collection and management of data from multiple sources, Evan’s team at Stats NZ was able to ease the burden on other agencies. Each agency benefitted from access to a site with a larger variety of data than any single agency could justify maintaining on its own. The open nature of the website means that the public has complete access to the data and can use it to better understand the policy decisions being made.
The data portal had many advantages over other government data sharing initiatives. By taking over stewardship of all of the data collected, Evan’s team at Stats NZ assumed the responsibility of ensuring that the data released does not identify any single person or any group. This removed much of the uncertainty and perceived risk that government managers would otherwise face. The responsibility for data cleaning, manipulation and display are also taken care of by Stats NZ experts.
The COVID-19 Data Portal represents a success for Stats NZ in its new mandate for data stewardship in government. The iterative nature of the project and the collaboration it produced between different experts across government agencies shows some potential of what can be achieved in future projects across government.
Acknowledgement
The author would like to thank Richard Evans, Stats NZ general manager for economic and environmental insights and for sharing his time and expertise.
is a Lecturer in Business Analytics at the University of Auckland. He received his PhD in Management Science from the University of Waterloo, Canada. Prior to his academic career, he worked in business analytics at a major Canadian insurance company, as an economist at the Socio-Economic Analysis and Modelling division at Statistics Canada and as a software developer at Research In Motion/BlackBerry. His research interests include business analytics, innovation in government and social network analysis.
References
Davenport, T (2018). HBR Guide to Data Analytics Basics for Managers. Harvard Business Review Press
Evans, R (2020, October 30). The COVID Challenge and SNZ’s New Economic Indicators. MBA Presentation, Business School, University of Auckland
Government of New Zealand (2011a). Declaration on Open and Transparent Government. Cabinet Minute of Decision. www.data.govt.nz/manage-data/policies/declaration-on-open-and-transparent-government
Government of New Zealand (2011b, December 20). Economic effects of the Canterbury earthquakes—New Zealand Parliament. www.parliament.nz/en/pb/research-papers/document/00PlibCIP051/economic-effects-of-the-canterbury-earthquakes
Hazell, R & Worthy, B (2010). Assessing the performance of freedom of information. Government Information Quarterly, 27(4), 352–359. doi.org/10.1016/j.giq.2010.03.005
Ihaka, R (1998). R: Past and Future History. www.stat.auckland.ac.nz/~ihaka/downloads/Interface98.pdf
Janssen, K (2012). Open Government Data and the Right to Information: Opportunities and Obstacles. The Journal of Community Informatics, 8(2), Article 2. doi.org/10.15353/joci.v8i2.3042
Leetaru, K & Schrodt, P (2013, April). GDELT: Global Data on Events, Language, and Tone, 1979–2012. International Studies Association Annual Conference, San Diego, CA. www.gdeltproject.org
McAfee, A & Brynjolfsson, E (2012, October 1). Big Data: The Management Revolution. Harvard Business Review, October 2012. hbr.org/2012/10/big-data-the-management-revolution
New Zealand Controller and Auditor General (2018). Data in the public sector. Office of the Auditor-General New Zealand. oag.parliament.nz/2018/public-sector-data
New Zealand Crown (2021). Open Government Partnership. ogp.org.nz
New Zealand Treasury (2020). New Zealand Activity Index (NZAC): Technical Note (p. 5). New Zealand Treasury. treasury.govt.nz/publications/nzac/nzac-technical-note
Orszag, PR (2009, December 8). Open Government Directive (M-10-06) [Memorandum]. obamawhitehouse.archives.gov/omb/assets/memoranda_2010/m10-06.pdf
Putt, S (2020, July 22). How Stats NZ democratised the use of data. CIO New Zealand. www.cio.com/article/3567928/how-Stats-nz-democratised-the-use-of-data.html
RStudio Inc (2021). Shiny. shiny.rstudio.com
Savoie, DJ (2013). Whatever Happened to the Music Teacher?: How Government Decides and Why. McGill-Queen’s University Press
Stats NZ (2020, April). COVID-19 data portal. COVID-19 Data Portal. www.stats.govt.nz/experimental/covid-19-data-portal
Tai, K-T (2021). Open government research over a decade: A systematic review. Government Information Quarterly, 38(2), 101566. doi.org/10.1016/j.giq.2021.101566
The R Foundation (2021). R: The R Project for Statistical Computing. www.r-project.org
The White House (2009, December). About Open Government. The White House. obamawhitehouse.archives.gov/node/8635